19 Oct 2026
Analyzing Historical Records of Small Lichen Observations Across Regions
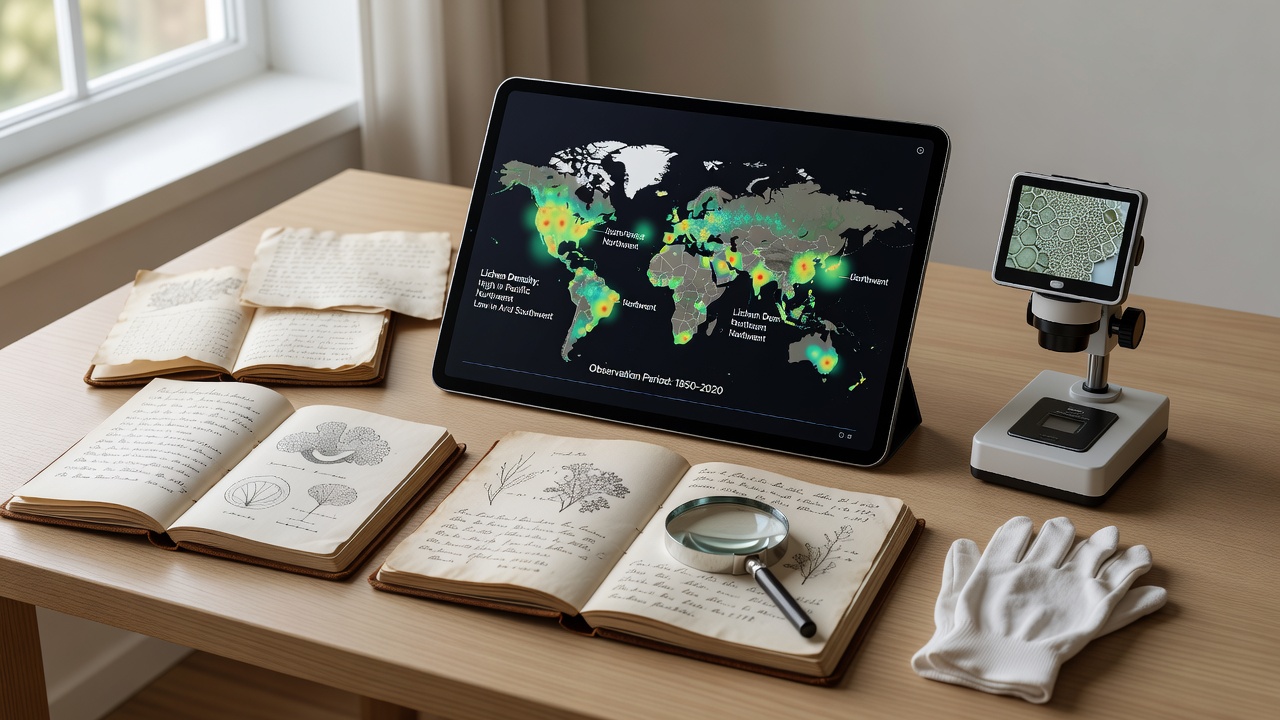
Historical records of small lichen observations span centuries of field notes, herbarium specimens, and early survey logs that researchers continue to examine for patterns in distribution and abundance. These archives cover diverse regions from boreal forests in northern Canada to arid zones in central Australia, and analysts combine them with modern geospatial tools to track changes over time. Data from the 1800s onward often appears in notebooks kept by naturalists who traveled with expeditions, while later entries include standardized measurements taken during government-funded surveys.
Methods Used in Record Analysis
Analysts digitize handwritten ledgers and cross-reference them against climate data sets to identify trends in small lichen presence across latitude bands. They apply statistical models that account for sampling effort variations, since early observers frequently visited accessible trails rather than remote interiors. Software packages now allow overlay of old collection sites onto current satellite imagery, revealing whether certain species have shifted ranges northward or contracted in southern extents. Researchers also employ machine learning classifiers to sort photographic plates from mid-20th century expeditions, which speeds up the process of extracting location coordinates and substrate types noted in the margins.
Regional Comparisons and Data Patterns
Records from northern Europe show denser small lichen coverage in the 1920s compared with entries logged after 1980, while parallel datasets from western North America indicate stable populations in coastal ranges but declines inland where air quality records document higher sulfur levels. In Asia, Japanese herbarium sheets dating to the Meiji era list many species on volcanic substrates that later surveys in the same prefectures report as absent, yet new occurrences appear in higher elevation zones. Australian archives maintained by state herbaria reveal episodic appearances tied to rainfall events, with clusters noted in the 1950s and again in the early 2000s after prolonged dry periods. Observers note that these regional differences emerge most clearly when analysts normalize for collection intensity and account for taxonomic revisions that reclassified certain tiny specimens over decades.
One study from the Canadian Museum of Nature compiled 19th-century expedition logs alongside recent monitoring transects and found that certain crustose forms now occupy 12 percent fewer sites in the southern boreal zone than they did before 1950. Similar work by teams at the University of Otago has examined subantarctic island notes and identified parallel shifts linked to temperature records rather than direct human disturbance.

Challenges in Interpreting Old Observations
Many early accounts lack precise geolocation data, forcing analysts to estimate positions from narrative descriptions of landmarks and travel routes. Taxonomic names have changed repeatedly, which requires mapping old labels to current species concepts before any quantitative comparison can proceed. Weathering of paper records and fading ink also introduce gaps, while some regions simply lack continuous series because political boundaries or access restrictions limited fieldwork during certain decades. Analysts therefore build confidence intervals around trend estimates and flag periods where data density drops below reliable thresholds.
Recent Developments and October 2026 Outlook
International working groups have begun releasing open-access versions of merged databases that combine North American, European, and Antarctic holdings, allowing simultaneous queries across continents. In October 2026 these groups plan to publish an expanded release that incorporates newly transcribed field books from private collections in South America and central Asia. The update will include standardized metadata fields for substrate pH and light exposure, which earlier digitization projects omitted. Participants expect the release to support finer-scale modeling of small lichen responses to documented temperature increases recorded since the 1970s.
Conclusion
Analysis of historical small lichen records continues to refine understanding of long-term distribution shifts across regions, with digitization and statistical techniques revealing patterns that single surveys could not detect. Ongoing efforts to standardize and expand these archives promise additional clarity as October 2026 approaches and new datasets become available for cross-regional study.